
Getting traces in
Ask your coding agent./overmind ensure-tracing reads your repository, works out where the instrumentation belongs, applies it, and verifies one real trace before it stops. Overmind’s empty Observability page hands you the same prompt if you’d rather paste it.
Run overmind sync first. It saves your project credential to .overmind/credentials.toml, which the Python SDK picks up automatically — no key in your code. Deployed processes get OVERMIND_API_KEY through their usual secret configuration.
To instrument by hand:
- Python
- Any language
- Traces you already have
init(), your OpenAI, Anthropic, Gemini, Agno and LangChain calls are captured on their own — prompts, completions, tool calls, tokens, latency, errors. run() marks one agent run and deliver() marks the result, which is what gets scored. The Python SDK reference covers the decorators for your own functions.Node.js has no Overmind SDK yet — instrument it with OpenTelemetry directly, as in the next tab. See the note.The OTLP endpoint
A stock OTel exporter appends
/v1/traces itself, so https://api.overmindlab.ai as the base URL is enough. Self-hosted, the same requests go to http://localhost:8000.
A project-scoped key pins every span to its project. Sending the same spans twice is safe. Trace ingest never costs credits.
The attributes Overmind reads
Overmind already understands the OTel GenAI, OpenLLMetry and OpenInference conventions, so models, providers, token counts, costs, tool names and message payloads from existing instrumentation land without any mapping of your own. Overmind prices each LLM span once, at ingest. A cost the span reports is kept; otherwise the cost comes from the model, token counts, cache reads and provider, at list prices for the span’s start time. Spans from OTLP and from connectors are priced the same way. These are the ones you set:
The Python SDK sets all of these for you.
Reaching the right capability
overmind.capability.id takes the capability’s UUID or the key it has in overmind.toml. Both survive renames. A span-level value beats the resource-level one, so one process can serve several capabilities.
overmind.capability.name is a display label. It never binds anything on its own.
Sessions
Put the sameconversation.id on the traces of one exchange — set_conversation_id("session-42"), or run(conversation_id=...) — and Overmind groups them into a session with its own score, token and cost totals, and timespan. The Sessions view lists them.
Scores on arrival
You don’t schedule scoring. When a run finishes, Overmind splits the trace into the units of work it contains, matches each one to a behaviour of your capability, and judges it with that capability’s active eval set. The result is the Score column, with every judge’s reasoning behind it. A run that dies before it finishes shows as interrupted and is still scored on what it did. Trace scoring covers how the score is composed.What you see in the Console
Observability is one filterable table with three views:- Task executions (the default) — one row per scored unit of work: the capability, the task it matched, its score, duration, tokens, cost and model. Group by conversation folds them under their session.
- Root traces — one row per run. This is the view you select from to build a dataset.
- Sessions — one row per conversation, with its session score.
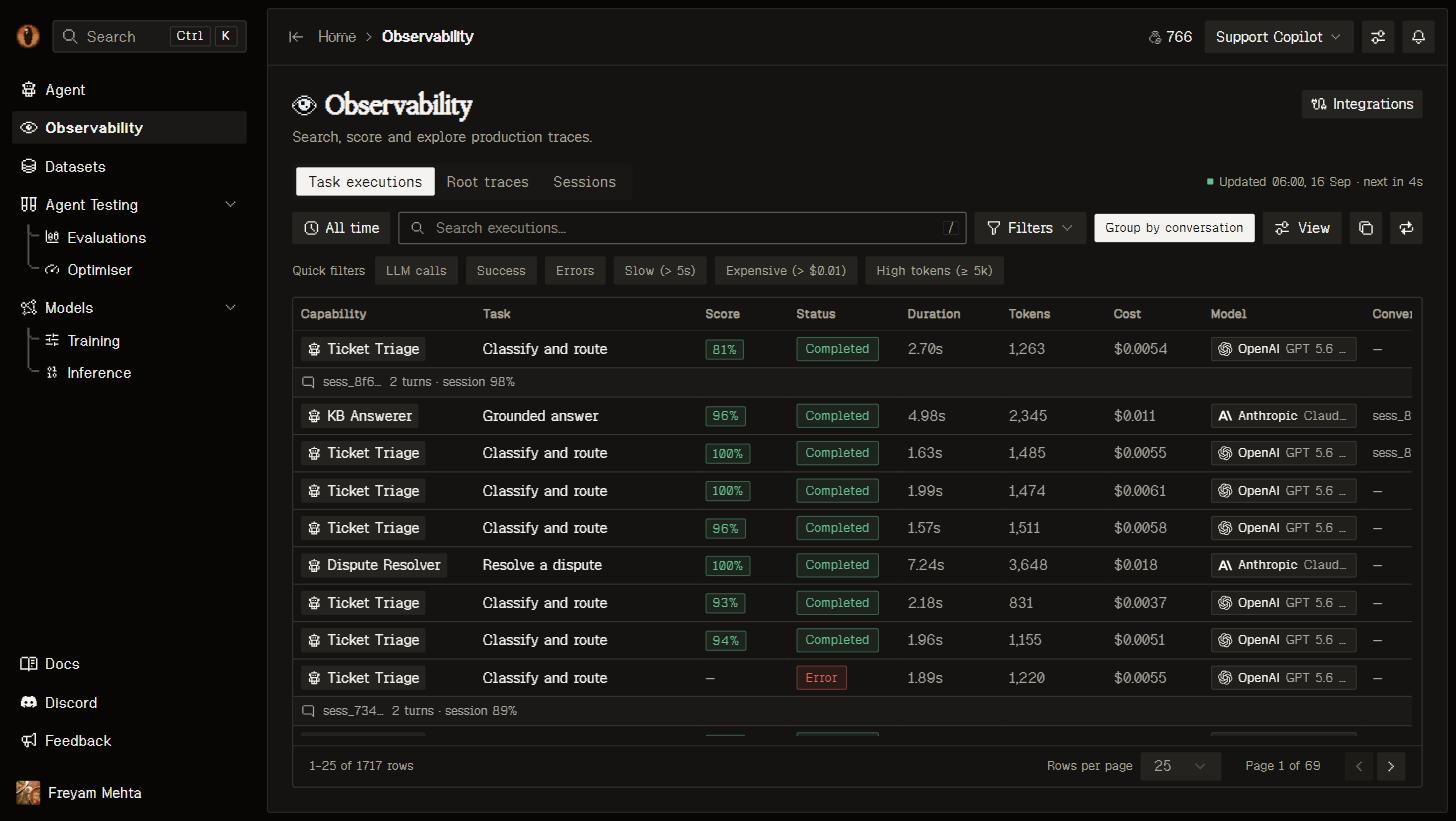
Task executions with quick filters. Score is the execution score; Task is the behaviour the run matched.
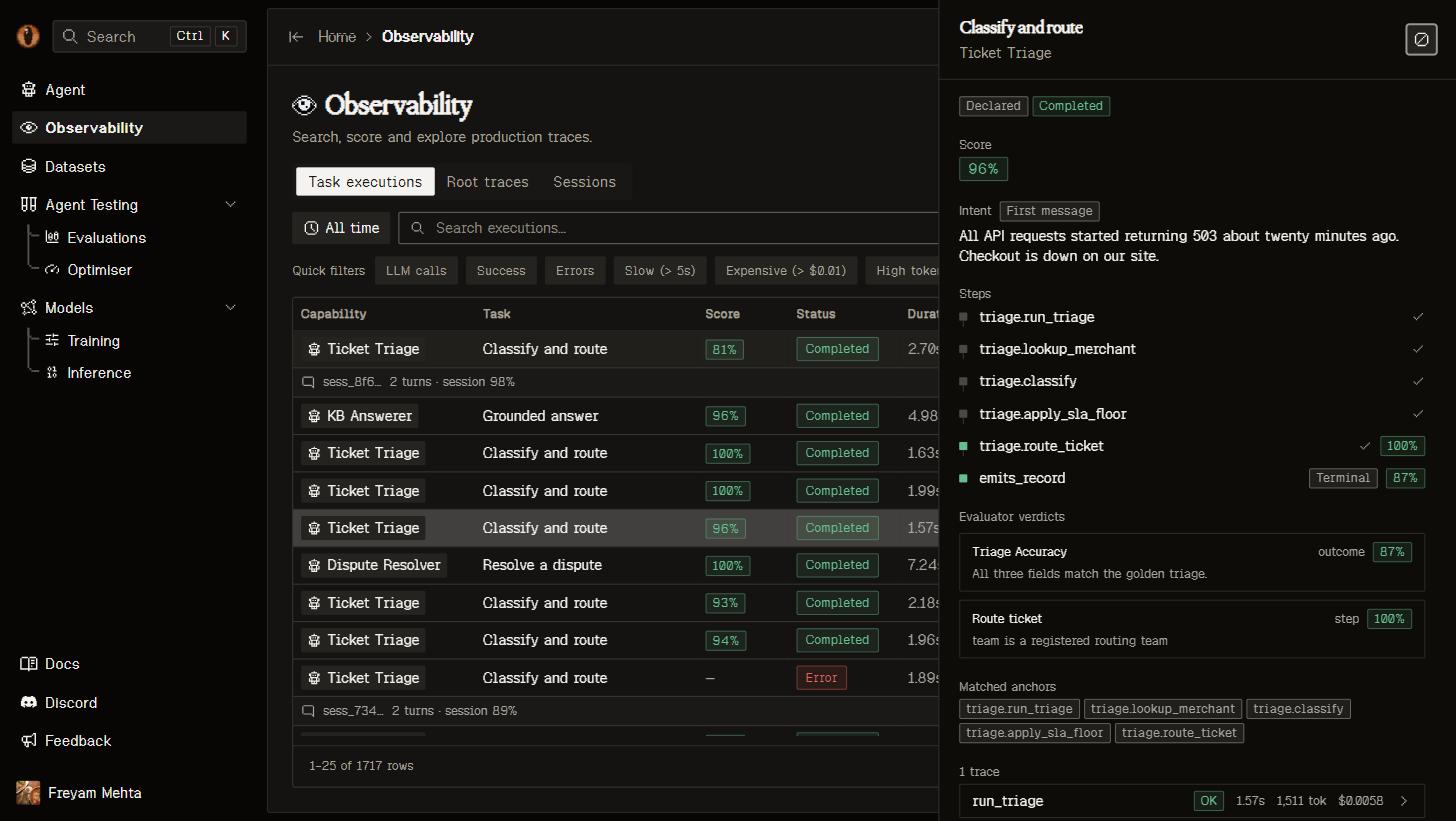
An execution: the intent, the route through the behaviour's steps, and every verdict with its reasoning.
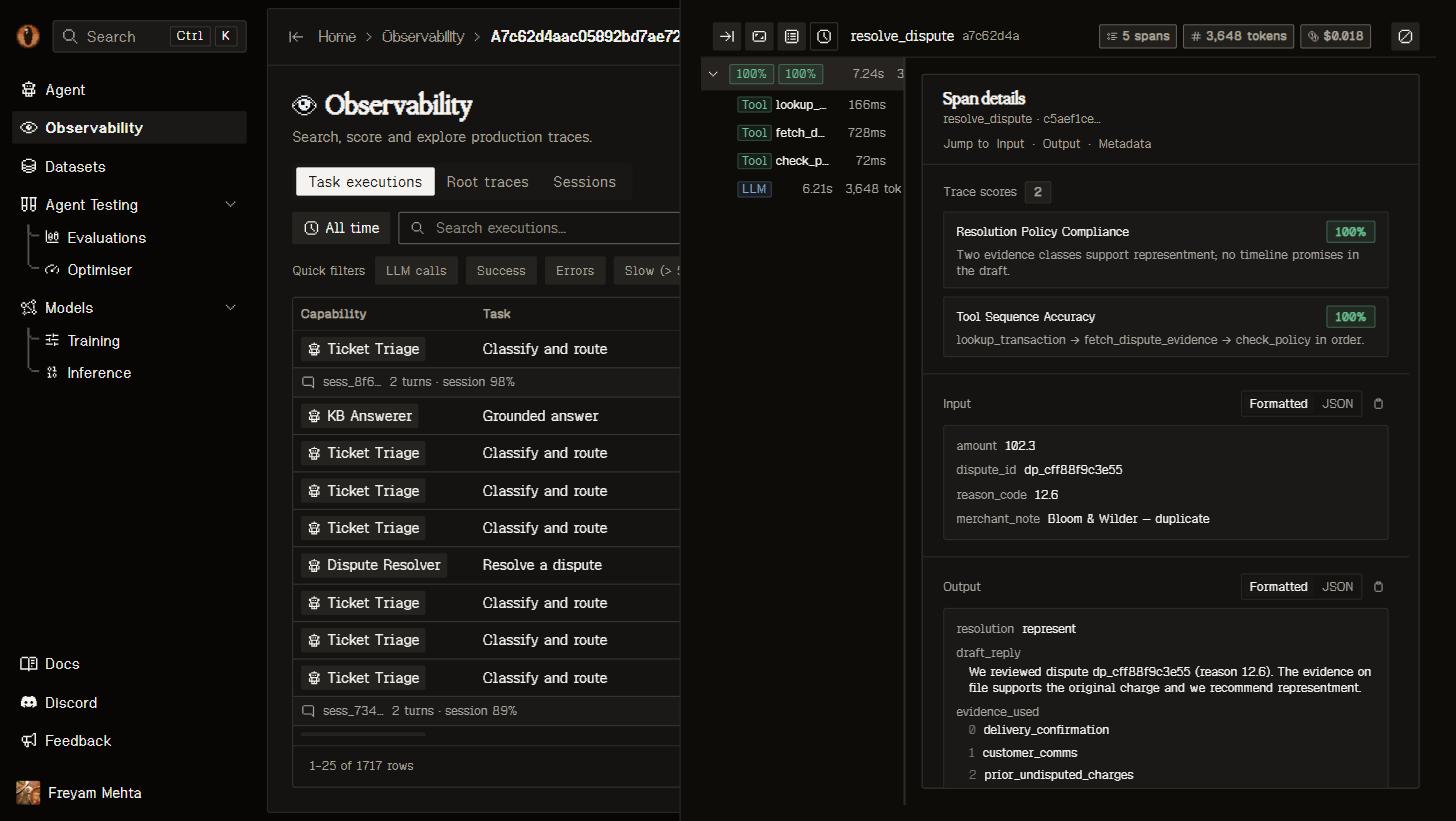
Trace detail: the span tree with token and cost rollups, plus the selected span's input and output.
From traces to datasets
In Root traces, select the runs you want — or Select all across pages — and Add to dataset. Each trace lands as one row with its transcript, its delivered output, its score and a link back. Datasets is what happens next.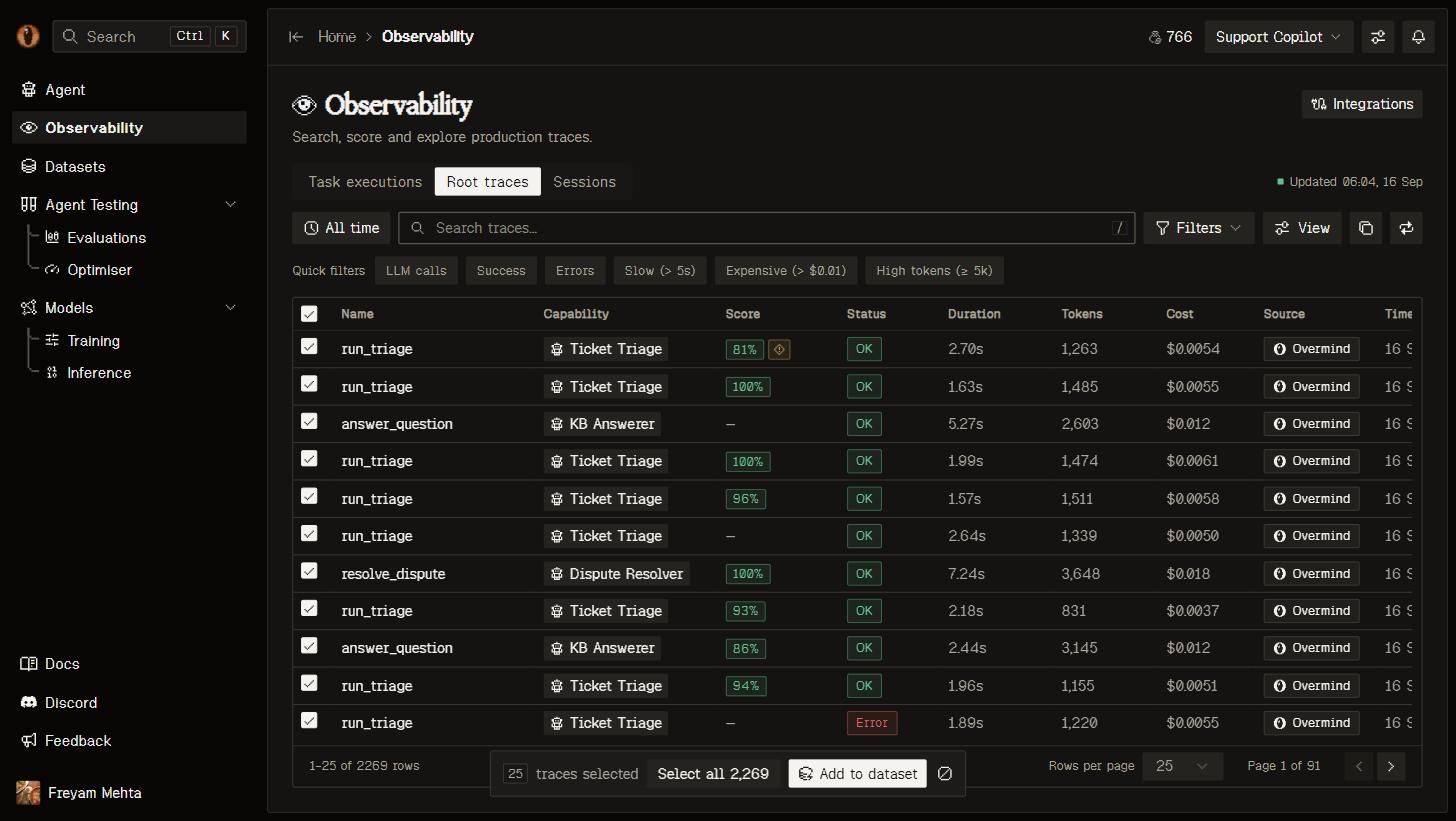
Selecting traces in the Root traces view, about to become a dataset.
Reading traces from your own code
Everything the Console shows is available over REST with the same API key:Good to know
- Call
init()once at startup, before the first model call, and give each process its ownservice_name. - Auto-instrumentation alone gives you flat model calls and no score. Wrap each run in
overmind.run()and calldeliver()on the result — that’s what creates something to judge. - Decorate the functions your capability’s behaviours are anchored on, so each run matches its behaviour and its step judges apply.
run()flushes on exit. For a short script with no run boundary, callforce_flush_traces()before it ends.
Next steps
Structure your traces
The decorators that make a trace mirror your agent’s real control flow.
See how scoring works
How a run becomes a score, and what to do when one looks wrong.
Build a dataset
Turn the runs you selected into eval or training data.
Read your capabilities
What the scan found in your repository and how traces attach to it.